Researching Facebook: ethics, techniques and discussions.

This paper is a discussion of the methods used in Examining the Social Media Echo Chamber (Knight, 2017, in progress) and in the research discussed  at http://www.meganknight.uk/journalism/social-media-research-project/ and http://www.meganknight.uk/researc/social-media-research-methods/. The paper is intended to highlight and open for discussion the issues surrounding social media research and its place in current social research.

The importance of researching news on social media

I was sitting in a panel discussion in July of 2016, listening to a series of papers on the media’s coverage of the 2016 UK Referendum on membership in the EU (Brexit) and the role this had played in the result, which was a surprise to many people (apparently even to the people who had campaigned for it). As is typical of media analysis, especially in the UK, discussion focused on newspapers and broadcast media, with a few mentions of Twitter. The researchers had all focused on print newspapers, not on online news sources, and none had considered how news content was targeted and shared through social media, when discussing how it had promoted and responded to Brexit. In fairness, the wider publication (Jackson et al., 2016), did include discussion of social media, but not of social media as the locus of news media – journalism and social media were discussed entirely separately. .

Social media has been extensively  researched since 2005, and as with all new media, the research has gone through phases, First, there is description and evangelising (Gant, 2007; Gillmor, 2006; Weinberger, 2007) – the focus here is on explaining the new medium and arguing for how it will change everything. The second phase is analytic, examining the new medium in detail, and comparing it with old media – (Knight, 2013, 2012; Knight and Cook, 2013). The final phase is normalisation, in which the new medium is simply absorbed into all discussions of media, and its place is assured as simply one of many media.

New media and social media should be moving into this phase, based on the overall usage and penetration of these forms of media (Gottfried and Shearer, 2016), but the rapid expansion of social media into the public sphere has left many researchers playing catch-up with  a technology that is moving faster than the academy can track it, and social media (and new media) present many specific technological challenges to conducting research into its content.

Most researchers conducting content analysis into the news media either collect physical examples, or use one of the standardised archives of news content (for newspapers this is usually Nexis, which archives the textual content of thousands of newspapers worldwide, and is readily accessible to most academic researchers). Broadcast media is more complicated, requiring the setting up of recording of broadcast shows, but still technologically straightforward. (Berger, 2011; Löffelholz and Weaver, 2008). Social media research methods are neither standardised, nor technologically straightforward and this presents specific challenges.

To start with, there is the problem of boundaries – how does one determine what social media content is news, and what is not? This is a more nuanced discussion than this paper has scope to consider, but it ties in to the fundamental collapse of professional boundaries which is the hallmark of the new and social media age (Gant, 2007; Knight and Cook, 2013). The second challenge is technological – how do you access and store social media content. Research requires that content be fixed and accessible, in order to allow for repeated viewings and analysis, and social media is by its nature fleeting and impermanent.

Social media sites allow for public viewing of content, but control the platform through which the content is viewed, and seldom allows for storage of content for later consumption or analysis. Social media companies grant more extensive access to the platform through an application programming interface (API) which allows for software tools to be written which can access and download the content for analysis. Different companies offer different facilities through their API, and many of them control access or charge for it, considering access to the raw and customisable data feed of social media as economic product.

The API is a fairly simple tool to use, but few media researchers have any programming skills. It will take a generation before knowledge of programming languages and the ability to write applications to access and analyse data becomes standard within media studies, and this makes researching social media more expensive and time-consuming than analysing more traditional forms. However, this is a problem, given that, increasingly, the news media is on social media, and for researchers who are interested in how the public use, view and engage with the news, social media research skills are fundamental.

Researching social media: the basics: beyond Twitter

Social media is generally accessed through a combination of search and the API, which allows for download and storage of the results of those search functions. Twitter has the most public search (most content is publicly viewable and open to search) and the most publicly accessible API of the main social media sites.  Twitter allows for any user to use the API to access and store content, up to seven days prior to the date of search, and with a limit of several thousand (the limits vary according to load and are not fixed)  (Twitter, n.d.). Because of this, several fairly simple tools are available to allow researchers to access and store data, such as Martin Hawksey’s TAGS service (Hawksey, 2013), and because of the accessibility both of Twitter content and the tools to store it, Twitter is by far the most researched social medium.

However, Twitter is not the most accessed medium for news content – the winner there is clearly Facebook. In 2016, 44% of US adults got some or all of their news and current affairs information through Facebook, and the number is increasing (Gottfried and Shearer, 2016) and only nine percent did the same for Twitter. Facebook is clearly where the researchers should be looking to understand news media consumption and content.

But Facebook is a more closed system. Twitter is a fairly simple structure – there are users, who post tweets, which can be reposted (retweeted), responded to, or favourited by other users. Tweets can be searched by content, or by simple metadata (user, location, language, date, links or media). All users and posts are by default publicly accessible (users can send private messages, and can limit access to an account’s content, but only by actively choosing to do so). Facebook is far more complicated. There are individual users, and services (pages or apps) which also provide content. Content can be posted, shared, liked, commented on and reshared, and access to content requires the reader to have the prior permission of the person/organisation who posted it. Most individual users’ content is only viewable by people who have a confirmed link with the user (“friends”). Most services’ content is publicly viewable.

Users see content that is based on users they are friends with, and services they have effectively subscribed too (by “liking” the service), but the content they see is controlled by Facebook’s algorithm, which selects from the possible content a user might see, and orders it in a combination of currency, popularity, similarity with content the user has previously engaged with, and other factors. The exact algorithm is secret, and Facebook does not reveal much about it, or how it works (Bakshy et al., 2015; Somaiya, 2014).

Access tools – the API

Facebook does have a public API, which can be used to access and download public content, and content the user already has access to. The API is more complicated than Twitter’s, because the content is more complicated, and has more layers of engagement, detail and permissions. Facebook’s API is mostly provided as a service for people who want to develop applications and games that will run on Facebook, garnering users and their information along the way, and this is a service that Facebook expects one to pay for, which makes it more complicated to access for researchers. Facebook also has extensive analytical tools, which are provided to service users who have applications or pages – they are very useful for accessing data about one’s own audience, but less useful for researchers. (Facebook, 2017)

A public research tool, Facepager, was developed by MIT in 2012. It is freely available and will download and store data in a reasonably accessible way, within the limits of the API. It does not allow you to see any data that is not publicly available, but is useful for analysing user engagement on public pages. It requires considerable awareness of data formats and the structure of the Facebook Graph API, and would not be easily understood by a researcher without a strong technology background. (Strohne, 2017)

For example, a simple Facepager research of the most recent 50 posts on each of the main UK news organisations reveals some interesting and useful insights. All sites were posting an average of 25 stories per day, with the exception of the Daily Express which had only 12 per day. By far the most popular news site, by count of “shares” was The Independent – its fifty stories were shared 17500 times. The Guardian was second with 10 600 shares and the Daily Mail a distant third with 4722 shares. The most popular stories on each service were:

Daily Express The man who wants to be our prime minister ladies and gentlemen
Daily Mail The Hollywood legend appeared in good spirits as he took a stroll through Beverly Hills on Friday
Daily Mirror She’d already had a dress specially-made when she found out she couldn’t go
The Guardian Can you still remember your landline number? Did you have a Hotmail account? Did you ever make a mix tape for someone you fancied? If so, you might be a xennial. Take our quiz to find out.
The Independent And an end to austerity
The Sun Low of bullets, this heroic group of soldiers decided to ‘go out fighting’ – with their BARE HANDS…
The Telegraph “There was something deeply emotional about Collins returning against the odds.”
The Times and The Sunday Times Resham Khan was injured in the 84th acid attack in London within six months


Which would indicate a strong interest in entertainment, sport and trivial news: something that is in line with popular perceptions of Facebook’s impact on news and civic society.

But the most shared stories overall were:

The Independent And an end to austerity
The Independent Intriguing
The Guardian Can you still remember your landline number? Did you have a Hotmail account? Did you ever make a mix tape for someone you fancied? If so, you might be a xennial. Take our quiz to find out.
The Independent America, 2017
The Guardian Barack Obama: “If people do not show respect and tolerance, eventually you have war and conflict. Sooner or later societies break down.”
The Independent Burma denies genocide claims
The Guardian “We know that MDMA works really well in helping people who have suffered trauma and it helps to build empathy. Many of my patients who are alcoholics have suffered some sort of trauma in their past and this plays a role in their addiction.”
The Guardian “The love I feel for my two eldest daughters, in their 20s now, is undiminished with the passing of time. I don’t get to express it so much, and they don’t feel the need to. Yet when I look at them sometimes, I feel exactly the same emotion I felt when they were barely walking, and helpless.”


Which is more hopeful, in that it contains considerably more hard news.

More detailed analysis would give  the number of comments per story, and even gives the identities of those who comment. There is considerable data available here, and considerable scope for further research.

But, if the researcher wants to access other users’ data (ie, to see what other people see and respond to, the researcher will need to develop an application that runs on the web, is subscribed to by users and is cleared by Facebook’s App Review process. This requires considerable web programming knowledge and access to a web server off of which to run the application. In my own case, I use PHP and export the data to MySQL, which then allows me to use standard database tools to analyse it.

The process uses the Facebook Graph API, which gives data about a user, including:

  • email
  • user_hometown
  • user_religion_politics
  • user_likes
  • user_status
  • user_about_me
  • user_location
  • user_tagged_places
  • user_birthday
  • user_photos
  • user_videos
  • user_education_history
  • user_posts
  • user_website
  • user_friends
  • user_relationship_details
  • user_work_history
  • user_games_activity
  • user_relationships

All of these pieces of information require the explicit permission of the user, which is obtained through the application install interface. The basic creation of an app on the system and its install by the end user gives the researcher access to the user’s name, public profile (user_about_me) and list of friends. All other information requires the application to go through the Facebook app approval process, and to justify the use of the data. This is not onerous, although it assumes that you are a commercial user, and is rather opaque. There is no clear access for researchers, or evidence of the importance of research.

The API is extremely limited, however. It does not allow you to see the user’s “feed”, the list of content the user sees, only to access content the user has posted, shared, or applications/pages they have followed. It also only allows you to access the most recent 25 of each of those items. As such, although it shows some evidence of engagement with content, it does not show the full nature of how the user experiences Facebook, and for news researchers, does not give the full picture of a user’s engagement with news by showing articles they have clicked on, read, or even seen in their feed.

In my most recent research, a corpus of 92 users was generated (mostly university students), and preliminary findings indicate that only 4% of the content followed on Facebook is explicitly news content, and only 10% of it is explicitly civic-minded (social and political campaigns, or news content). (Knight, 2017)

Although the tools Facebook already provides are useful, and open up considerable research for those with the skills and expertise to use them, there remains a significant gap in the access researchers need in order to adequately consider the impact the service is having on civic society. The “Facebook algorithm”  and the subsequent “echo chamber” it has created, has become something of a mythical beast in the public sphere. To date, there has been one published paper on the subject, which analysed the extent to which users’ feeds limited their exposure to points of view which with they disagreed. Bakshy et al’s paper found that users were less exposed to content that conflicted with their stated political affiliation (political viewpoint is a field in the Facebook profile), and less likely to click on or share a link that they disagree with. (Bakshy et al., 2015). Eytan Bakshy worked at Facebook and had unique levels of access to the raw data, something no researcher has had since. As Facebook becomes increasingly important in the civic sphere, it becomes more and more essential that researchers be given access to the full corpus of data, in order to adequately assess the impact of this increasingly dominant media company.

Ethical concerns

Social media is widely perceived as private communication by its users. Facebook, especially, is viewed as private, and not something that random members of the public should be able to see. Researching social media has the tendency to trigger concerns about the ethics of looking at people’s social media content, as though it were truly private.

In the case of Twitter, there is now considerable awareness of the public nature of the service, and in several countries there is legal precedent that recognises Twitter posts as legally the same as any other public speech, which renders ethical concerns largely moot.

Facebook is more complicated – public content is common, but it is not clear to what extent users are aware that their posts are public, despite Facebook giving users considerable control over their own privacy settings. In addition, Facebook makes a large number of interactions with public pages public, so in my corpus of news articles mentioned above, I have the Facebook names of everyone who commented on any of the stories in the corpus. Logically, this makes sense, but I suspect that if I collated those comments and contacted their authors for additional commentary, they would be surprised, and a fair number would feel that I had invaded their privacy. This creates a problem for researchers – ethical guidelines require that people not be observed without their knowledge and consent, but how do you get consent of someone who has posted publicly, but thinks they are in private?

When an application is created using the Facebook API, the user is prompted to allow the application to access their content, and because this prompt is generated by Facebook, not the researcher, there can be no deception. However, within the corpus of data that can be extracted from the feed are names and potentially identifying details of friends of the person who consented. In my corpus of data there are multiple posts that reference things like drug taking with named friends: although the names of the posters are stripped out (a requirement of the research approval, Facebook has no problem with my knowing the names of people who participated), it would be fairly easy for me to identify the poster and their friends.

Facebook’s permissions are, in fact, considerably less strict than research ethics guidelines would normally find acceptable, since they are designed to maximise revenue from advertising (data about their users is what Facebook sells, and the more detailed and specific that data is, the more lucrative it is), leaving academics to construct their own guidelines and norms within the practice.

Further questions

This is not intended as a comprehensive paper, but as a starting point for discussion and considerations for the development of methods, guidelines and tools for researching Facebook’s impact on the news. A few considerations:

  1. Development of public tools for Facebook research. Facepager is open source, and could be developed further, with the right skills/tools. It is not clear what MIT’s plans for it are, but it is built on an older version of the API, and is likely to stop working unless updated.
  2. Petitioning Facebook for additional access for researchers. Facebook can be responsive and helpful in many cases, and it might be possible to approach them with a view to developing a more open version of the API for researchers with bona fides?
  3. Development of sandbox and black box research tools?


References:

Bakshy, E., Messing, S., Adamic, L.A., 2015. Exposure to ideologically diverse news and opinion on Facebook. Science 348, 1130–1132. doi:10.1126/science.aaa1160

Berger, A., 2011. Media and communication research methods : an introduction to qualitative and quantitative approaches, 2nd ed. ed. SAGE Publications, Thousand Oaks.

Facebook, 2017. Facebook for Developers [WWW Document]. Facebook Dev. URL https://developers.facebook.com/products/ (accessed 7.2.17).

Gant, S., 2007. We’re all journalists now : the transformation of the press and reshaping of the law in the Internet age, 1st Free Press hardcover ed. ed. Free Press, New York.

Gillmor, D., 2006. We the media : grassroots journalism by the people, for the people, Pbk. ed. ed. O’Reilly, Beijing ;;Sebastopol  CA.

Gottfried, J., Shearer, E., 2016. News Use Across Social Media Platforms 2016. Pew Res. Cent. Journal. Proj.

Hawksey, M., 2013. Twitter Archiving Google Spreadsheet TAGS v5. MASHe.

Jackson, D., Thorsen, E., Wring, D., 2016. EU Referendum Analysis 2016.

Knight, M., 2017. Examining the Social Media Echo Chamber. Presented at the International Association for Media and Communications Research.

Knight, M., 2013. The revolution will be facebooked, broadcast and published. doi:10.13140/RG.2.1.4948.4567

Knight, M., 2012. Journalism as usual: The use of social media as a newsgathering tool in the coverage of the Iranian elections in 2009. J. Media Pract. 13, 61–74.

Knight, M., Cook, C., 2013. Social media for journalists: principles and practice. Sage Publications, [S.l.].

Löffelholz, M., Weaver, D.H., 2008. Global journalism research : theories, methods, findings, future. Blackwell Pub., Malden, MA.

Somaiya, R., 2014. How Facebook Is Changing the Way Its Users Consume Journalism. N. Y. Times.

Strohne, 2017. Facepager.

Twitter, n.d. API Overview — Twitter Developers [WWW Document]. URL https://dev.twitter.com/overview/api (accessed 7.2.17).

Weinberger, D., 2007. Everything is miscellaneous: the power of the new digital disorder. Henry Holt and Company, New York.
 

An alien in England: of pink cards, ninety-page forms and thousands of pounds.

This article, and issue, is getting a lot of comment, as well it should. However, the rather breathless naivety with which a fair number of my British friends have responded to this has made me realise some things that British people may not know about life as a foreigner in this country.

I am a resident alien. I have “indefinite leave to remain” (a phrase designed to weed out non-native speakers of British English at the first hurdle – try parsing that for your average eight year old). I have been here since 2008. A few notes about the experience (and bear in mind, that I am a highly educated white person from a first world country, who speaks English pretty much perfectly, who came here at the invitation of a university to take up a job – I am by far the most desirable of immigrants (by the standards of those who measure such things) and the most privileged, and my treatment was almost certainly the best of all possible treatments in the system).

1. I was deported on arrival. This is not uncommon. There was an error in the application for my work permit (not my error) and as a result, one Janet, working the border at Manchester International Airport, determined I was not legally entitled to enter the country. I spent a few hours sitting in the “immigration penalty box”, the glass-walled area to one side of the border for people to gawk at, before being escorted to collect my luggage, fingerprinted, and left alone in a locked room. I was not allowed to speak to Martin (his parents are British, and he has a British passport), and was told I would be flown back to Qatar. After a few hours, Janet went off shift, and I managed to persuade Hardeep, who replaced her, that I could be allowed to enter the country for twenty-four hours to arrange a flight to Canada, rather than Qatar, which would simply deny me entry. They confiscated my passport, and I was allowed to go to Preston, find Martin, book a flight to Canada and have a delightful conversation with my new boss and HR department to explain what had gone wrong. I called the immigration office at Manchester and gave them the details of my flight, two days hence (this was Friday, and the first flight I could get was on Monday), as I had been instructed to.

The next morning, at six am, the police arrived at the guest house we were staying at, and demanded to see me: according to them I had now been in the country more than my allowed twenty-four hours and was to be arrested. I showed them the details of my flight, and was allowed to call the Manchester Airport immigration centre, where, miracle of miracles, I was able to speak to Hardeep, and she managed to persuade the police that all was well, and after several conversations and tense waiting, they stood down. The guest house (where Martin ended up staying for another week on his own) were politely, and Britishly furious and resentful, and never forgave us. Breakfast was served with a side of spite and bile thenceforth.

On Monday I went to Manchester Airport for my flight (via the USA, because it was the first affordable flight I could get). I had no passport, and did as instructed, tried to check in and told the official that my passport was being held for me. Unfortunately, before checking in, I had to pass an American screening process, which I couldn’t do without a passport, and the American official was not interested in any explanation, and was loudly vocal in expressing this. I had to go to customer service, who called security, who showed up with guns, uniforms and my passport. Two of them escorted me to the American screening desk, where my recent UAE residence permit and assorted regional stamps caused a massive amount of interest and shouting and demands to know how long I had been in Saudi and what I had been doing there (I had not been to Saudi) – I am reasonably sure none of the Americans read Arabic, and they resisted all efforts on the part of anyone, me included, to explain. Finally, the Americans agreed that I could be allowed to proceed. Throughout this process, I was not allowed to touch my passport, I was made to stand to one side while an armed security guard dealt with the paperwork. Security stayed with me throughout the wait in the departure lounge, and only gave me my passport back at the door of the plane, my having been sufficiently publicly humiliated for now that they could let me go to the relatively humane treatment of USAir (insert hollow laugh here).

Once in Canada (after having to go through US border control, something which I will never do again, if I have any say in the matter), I had to spend ten days waiting for a new entry clearance (which went fairly smoothly – and thanks so much to the lovely invisible friends who let me squat in their basement), and then flew back to Manchester. Janet was not working the border when I arrived (I looked for her every time I came home through Manchester, and once had her as my official, but she betrayed no acknowledgement of me, or of what had happened), and after a tense few minutes my explanation was accepted, and I was allowed in, this time WITH my passport. Until that passport expired, I had to explain in great detail every single time I came in to the country why I had been denied entry, and was eyed suspiciously by all and sundry.

2. ID cards (residence permits) were introduced for all foreign residents in 2008. Before that, your residence was an insert into your passport, now it is a pink biometric ID card. In 2010, my passport expired, and I had to get an ID card to replace the entry clearance in my old passport. This cost several hundred pounds, and required me to go to the visa office in Liverpool for a day. I filled in my forms, made my appointment, paid my fee, paid the additional fee for faster service (see next part), and headed to Liverpool. About the fees, every single engagement with the home office comes at a cost, and there are always three tiers of cost. First is the basic service, usually postal, which requires you to send off all of your identifying documents to the abyss of a sorting centre somewhere in the UK, and wait for up to six weeks (sometimes forever) for your papers to be returned to you, duly stamped and processed, and one hopes, not denied (if they are, there is no appeal, no refunds and no explanation). Next is the premium service, which requires you to go to a centre somewhere and show your documents to an official, who checks them and returns them to you. You get your response within five days and get to keep your ID. Finally there is the super-premium (oligarchs and sheikhs) service, which is 24 hours, at your convenience, and probably involves gold-rimmed tea sets and sexual favours (at least, it should, for that price).

Appointment is a vague term. In this case it means come at that time and we’ll allow you to join the queue around then, if there’s space in the holding area. The place was packed, everyone clutching their papers, no food or drink is permitted, and the chairs are bolted to the floor. There is a ticketing system, and numbers are called, for various things. You get called to pay, then to confirm payment, then to have your papers looked at, then to be fingerprinted, then to have your iris scanned, then to be photographed, and then, finally, to be told you are done.It took most of a day, and there were people still there who had been there when I came, and seemed to have made no progress in those hours. My pink ID card arrived a week later.

3. Indefinite leave to remain. My work permit was valid for five years. At the end of that time, I could leave the country, have my employer apply for a new work permit (now called a tier 2 visa) or apply for indefinite leave to remain. Work permits are limited to one employer (ie, I couldn’t quit my job and go elsewhere in the UK – the work permit was effectively UCLan’s, not mine), and are tentative, so I opted for indefinite leave to remain. This is not simple. First, you have to pass the “Life in the UK” test. This costs money (of course) and you have to pay for the books (there is a good second hand trade in these), and is not a simple test. The test was interesting, and I learned a lot about the UK while studying for it. It has changed since, but when I took it, it included a lot of information about legal rights and responsibilities and how civil society works, and I doubt I have a British friend who could pass it. The test itself happens in a testing centre in a city (in my case Manchester), and you have to wait, then do the test on an ancient computer. You then have to sit until EVERYONE is done the test, then you have to wait again while each person is called in to hear their results, and escorted out through a separate door. It takes hours, mostly pointless, the kind of process that seems to have been designed primarily to remind the participants that they are at the mercy of mindless authority. I passed the test, and got a piece of A4 printer paper confirming that.

Then I had to prove I speak English. Yes. Really. My university degrees were from Canada and South Africa, both officially multi-lingual countries, so a degree from one of them does not count as evidence of English. No amount of discussion was allowed: according to them, I could have written my masters in Afrikaans (or Xhosa, or Zulu, or Sesotho, or…) at Rhodes University (bastion of South African Englishness that it still is, notwithstanding), or done my Bachelors in French (in far western Canada, where Mandarin and Punjabi are more widely spoken than French). The fact that I work and teach at a British university was irrelevant. Finally, they accepted my PGCertHE from Middlesex, as evidence of my speaking good enough English to stay. I was slightly disappointed, I’d kind of like to do the IELTS test, but it was expensive, and couldn’t be booked in time.

Yes, time. You have ninety days to apply for and receive indefinite leave to remain. You can only apply ninety days or fewer before the expiry of your work permit, and must have received indefinite leave to remain before your permit expires, or be deported.

The form is ninety four pages long. The guidance on completing the form is the same length, and has multiple references to things on websites. It took a week, at least, to complete. Among the things I needed were a detailed list of every single time I had left the country in time since I arrived, and formal confirmation from my employer that I was either on university business or had booked annual leave, for every visit. I also had to have the university write something confirming that they would continue to employ me after I had received indefinite leave to remain. The university’s HR department pretty much refused to do this, despite my having evidence of leave and and university-booked trips for every single one. I had to remind my dean that if they didn’t do the letters I would have to leave the country, and someone else would have to do my marking, which finally unstuck something and I got my letters. I had to have rent receipts for the full time I was in the UK, bank and tax statements, police clearances, vaccinations (not really, but I did need the NHS to confirm I don’t have TB) and probably dental records as well. It was a pile fourteen centimetres high of every single document I had ever received.

Exactly ninety days before my permit expired, I went online to make the appointment. No availability for six months.

Cue quiet hysterical screaming.

Call the call centre.

Keep trying, we release new appointments all the time.

A week of trying. Nothing.

Go online to the many many UKVI help forums, where I find out that new appointments are released on the system at midnight on Thursdays.

Finally, success, I have an appointment in Belfast two days before my permit expires. Belfast.

I pay the fees, this time it is thousands of pounds, and the additional fee for one-week premium service.

I keep checking the site, and eventually manage to switch to an appointment in Sheffield, which is cheaper and easier to get to. All appointments are at 9am, so we have to spend the night in Sheffield.

At 8:45am I arrive at the place in Sheffield, a non-descript government office, my towering pile of papers clutched in my hands (actually in a document box) and join dozens of other people waiting outside in Sheffield, in February. At 9am we are allowed in, through security, and we sit and silently judge each other’s piles of documents, and wait.

Three rounds of take a number here and wait to be called to check your payment receipts, check your appointment details, and I get to sit down in front of an official who picks up my ninety four page form, reads the first page, flicks to the end, reads the last page, glances at my box of papers, picks up my passport and looks at the picture, stamps my form and says “alright”.

Umm, what?

Do I take another number?

“No, that’s fine, we’ll send your confirmation in the post”

Really? I don’t need to do anything else?

Visibly annoyed now: “no, that’s fine, it’s all sorted, you’ll get your confirmation of indefinite leave to remain in the post”.

And that was it. Thousands of pounds, weeks of form filling and document collecting, nights of staying up to get an appointment, and she doesn’t even READ THE FRIGGING FORM, much less look at anything else.

I got my replacement pink ID card in the post, as she promised. I’m supposed to carry it with me at all times. I don’t.

Social media research – repo readme

Code for extracting Facebook Data for research project – http://www.meganknight.uk/uncategorized/social-media-research-project/

This project is developing the research discussed at http://www.meganknight.uk/journalism/social-media-research-project/ and at http://www.meganknight.uk/uncategorized/facebook-and-the-news/

It is built with the Facebook Graph API, and runs on PHP, and a simple mysql database

THe code in this repo works as follows:

  1. Collects basic consent data from a user (index.php), assigns a unique id and records the consent with that ID.
  2. Asks the user to sign in to Facebook and accept the app’s conditions (formresult.php).
  3. Gathers the Facebook user id, checks whether it has already been recorded, and if not records it once in a table.

    If it has been used, the process proceeds as normal, but the unique id is tagged as a duplicate record.

  4. Collects the most recent likes and posts by the user, and their political beliefs and birthday (to calculate age).
  5. Stores this data in tables, linked to the unique id generated in step 1. This is never linked to the Facebook ID, and there is no way to reconnect the two pieces of data.
  6. Asks a brief survey of news awareness, and stores those in the database.

Social media research – methods

This project is an operationalisation of the ideas expressed in the paper “Facebook is changing news”, to be published in Rhodes Journalism Review, 2017 (a draft is available at http://www.meganknight.uk/uncategorized/facebook-and-the-news/). The research will analyse the news content of people’s Facebook feeds in order to determine the impact false and overly biased news sources have on people’s understanding of the world. The initial stages of the study will simply focus on which news stories are seen by users, and whether these correspond with dominant views on current affairs as presented by a selection of mainstream UK news outlets.

This research will employ the Facebook public API to access individual users’ Facebook feeds (with permission, and fully anonymised) in order to determine the nature and quantity of news material presented within this platform. The data will be extracted by means of a Facebook App, to which users will agree. The data is then anonymised and sent to the research repository.

Analysis will be by content analysis, and comparisons will be made with news accessed through more traditional means, and through comparisons with basic demographic information as gathered by the Facebook app.

The participant information sheet is here.

The actual application is here. 

There is a code repository here. 


Social Media Research Project


I am a researcher at the University of Hertfordshire, and I am running a project investigating how social media influences the news we consume, and what we know about the world.

In order to do this, I am looking for people to contribute anonymised data from their own Facebook profile, which I can then analyse. I need to see individual people’s news feeds because Facebook does not show the same information to everyone, but only a selection of news and posts based on who you are, who your friends are, and the kinds of stories you have liked or shared yourself.

If you agree to this project, you will be asked to install an application on your Facebook account, which will extract the most recent posts from your news feed and the list of pages you have liked, remove all identifying information (your name, and the names of all of your friends will be replaced by random strings of numbers, and I will never know who you are, or whether you participated) and send me only the content of your news feed and the pages you have liked. It will also send me your age, gender and political views from Facebook’s “About” page.

The application will also ask you five questions about your overall level of interest in news and current affairs.  The whole process will take no more than five minutes and you will be able to withdraw at any stage.

The data that is extracted will be sent to me electronically, through a secure server. I will then analyse the data I receive and plan to publish my research. To be clear – no names, neither yours or those of your friends, will be recorded as part of this study. I am only looking at the news sources you see and, where you have included it in your profile, information about your age, gender and political outlook. No personally identifying information at all will be collected.

If you want to participate, please click this link

You can see more information about why I am doing this, and the justifications for its importance at: http://www.meganknight.uk/uncategorized/facebook-and-the-news/ and can read about my previous research at: http://researchprofiles.herts.ac.uk/portal/en/persons/megan-knight(8150ae0b-0ac4-49de-8013-1262707f28f8).html

This project has been vetted by the University of Hertfordshire’s ethics approval process, reference number: TA/SF/UH/03015

You can contact me directly on m.knight3@herts.ac.uk

Thank you for your time

Dr Megan Knight

Media Research Group

University of Hertfordshire

https://herts.academia.edu/MeganKnight

tel: +44(0)1707 285 390 | mob: +44(0)7709 399 210

email: m.knight3@herts.ac.uk | skype: meganknight

Analysing Twitter feeds: notes and experiences

I have a bad habit of doing complicated things once, and then having to reinvent the wheel the next time I attempt something similar. I know enough code to be a frustration to myself and others, so I keep forgetting things I used to know. I’ve just finished a paper (or a draft of a paper) for IAMCR2016, in which I collected and analysed 30-odd Twitter feeds over three months worth of data, something like 120 000 Tweets. So, here is what I did, and what I learned about doing it. The actual paper is here.

To collect the actual Tweets, I used M Hawksey’s Twitter Archiving Google Sheet (TAGS), available here.

I started collecting everything from the #oscarpistorius and #oscartrial hashtags, but the sheets have a limit of around 50 000 tweets, and were crashing often. I used various lists and reading/checking to gather the names of thirty journalists who were Tweeting the trial. I set up a separate TAGS sheet for each one, limiting the search by using from:username in the search field. There are various search operators you can use, there’s a list here.

I set the sheets to update every hour, and kept an eye on them. It’s fortunate that Twitter allows you to collect Tweets from up to seven days ago, so I had a few days from the start of the trial to get my searches and sheets in order.

I had to create several Twitter accounts to use for the OAuth keys, I kept getting locked out for overusing the free API. TAGS version 6.0 doesn’t seem to need OAuth, or it’s fully scripted, but I would worry slightly about being locked out. The sheets crashed a few times, hitting the spreadsheet limit, so I had to create multiple sheets for some users. At the end I had around fifty sheets. TAGS is very easy to use, and doesn’t need a server to run, but the limit of working with Google Sheets is a bit frustrating. Setting everything up was very slow.

Once I had the data, I bulk downloaded everything, and ended up with Excel files on my desktop.

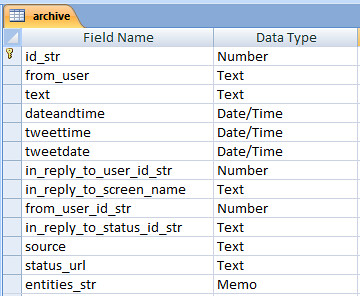
I used MS Access for the main analysis. I know a bit of SQL from way back, and Access is pretty readily available. I imported all of the sheets into a single table, called archive. I had already created a separate table called users, which contained information about each account. The table structure for the archive table was pretty much determined by Twitter’s data structure.

archive

Data structure. The Tweetdate and Tweettime fields were added later.

I used Access’s inbuilt tools to remove duplicates from the archive. TAGS has a function to do this in the Google Sheet, but the files were so large the script was battling, so I opted to do it once I had a full archive.

Twitter provides a date/time stamp for all Tweets, in a single field, formatted “Fri Sep 12 11:56:48 +0000 2014”. I split this field into two new fields, one date, one time, by copying the field and then using Access’s field formatting to strip the time and date out respectively. I then filtered all tweets by dates on which the trial was in session (based on this Wikipedia article, I confess, but I did check that this tallied with the data I had). I also filtered the Tweets by time, limiting the archive to time between 9am and 5pm, South Africa times (Twitter’s timestamp is universal time). I then read through the feeds, and removed any days in which it was clear thejournalist was not in the courtroom. I also removed a large number of Tweets from the official news organisation accounts (in retrospect, I wouldn’t include this if I did it again) that were not about the trial. I initially intended to filter by hashtags, but hashtag usage was inconsistent, to say the least, so this didn’t work.

That left me with around 80 000 Tweets to play with. I did some basic select queries to pull out volume of Tweets per day, and per user per day, pasted into Excel and made charts.

I then pulled the text of tweets, converted to json using this tool and then used Marco Bonzanini’s excellent tutorial on mining tweets with Python and the NLTK to extract hashtags from the corpus.

Mentions and retweets are harder to analyse. Twitter does store replies as metadata, but not retweets. The NLTK can’t work with two-word terms (or I couldn’t work out how to do this), so they can’t be counted. I replaced all occurrences of “RT @” with “RTAT” (after first checking whether that string occurred anywhere else within the corpus) and then used the NLTK to analyse all terms starting with RTAT, to extract most popular retweetees.

It was simpler to extract 24 separate JSON files for each user, and run the same analysis again than to iterate the code (my Python skills are woefully bad), so I did that.

Links to images are stored in the “entities” metadata with the media tag, but this field is too long to be stored as text in Access, so it can’t be easily analysed – it can be filtered, but not queried, for reasons I don’t understand. I filtered by the media tag, and exported to CSV where I used Excel to select a random set of images to analyse. These had to then be manually viewed on the web to conduct the analysis.

Links were likewise extracted from the metadata by filtering, exporting to Excel and using Excel’s matching tools to extract the actual URLs. Links are shortened in the text, but in most cases the meta tag retains the full URLs. In some cases, the URL in the metadata is again shortened, and I used Python to extract the full URLs and then updated the table with the correct URL. These were then analysed in the database, and tagged by type manually. (I could have done this automatically, but there are times when doing something manually is quicker and simpler than automating the code).

Queries were used to extract numbers of various occurrences and exported to Excel to generate graphs and charts.

I know there are better and more efficient ways to do all of this, but focusing on what works is what matters to me most of the time.

Facebook and the news

Paper for Rhodes Journalism Review, May 2016.

Facebook is changing news. We know this, we have known it for some time. This is not another piece about how the news industry is under threat, how social media is stealing its audience and advertisers (although all of those things are true). This is about Facebook, and how it is becoming the “newspaper of record” for the world, and how disturbing a thought that is.
If Hollywood is to be believed, Facebook was founded by a guy who wanted to get girls. It’s the classic story, boy meets girl, boy loses girl (actually girl dumps boy, but let’s not get into issues of women’s agency in popular culture representations here), boy invents new technology to get revenge on girl and find new girl. It’s probably not that simple, but the basic impetus is true – Facebook was founded as a means to foster social connections, initially within a university campus, and then across the Internet.
In its initial iteration, Facebook’s focus was on the profile, and the information contained within. This section was the only section that allowed pictures, and it originally allowed you to say whether you were looking for friendship, relationships, or something else. Status updates were limited to words, and were not preserved in a timeline or “feed”. All members of the site were searchable, and connections could be easily made. In other words, it was like a dating site. From here, the site evolved to allow people to see a timeline of their friends’ activities, the “news feed”, which changed the system from a directory to a regular source of information. This changed the site from one you used occasionally to find someone, to one that contained all the latest information about your social circle, and thus needed to be checked regularly, and is the thing that made Facebook the most successful social media site by far. This change was followed by the ability to post pictures (and later video), the creation of apps and games, groups and then pages, companies, messenger services, money transfer and so on. (Anders, 2014; Prashanth, 2013).
In many ways, the evolution of Facebook mirrors the maturing process of its audience. From a site to find friends and relationships, to share gossip and make plans, much in keeping with its late adolescent users’ focus on social interactions within a closed group, it has become a place to share comment and ideas about the larger world, as those users grew up and developed outside interests. Facebook has not necessarily embraced these changes – in many cases, functions and services were added because users were themselves “gaming the system” to provide those, or because of the fear of losing users to other services and sites that did provide them. Facebook Messenger is a clear example of this, being direct competition to Google Chat/Hangouts/Voice, which was itself a response to the facilities offered by Skype.
Facebook recently made the tech news again, with a leak from a source claiming that the company was concerned that people were no longer posting personal pictures, images and stories, but were using the site to share third party information (cat videos, memes and jokes, but also news). (Frier, 2016) This has apparently been dubbed “context collapse” although it’s not clear why. What is clear is that the posting of original content by users on the site is down, that users are reposting more material from elsewhere (Efrati, 2016) and that Facebook is introducing new features to encourage more personal sharing, such as live video (recently used by Fahamalo Kihe Eiki to stream the birth of his child to 90 000 people (Woolf, 2016)), near-automatic posting from mobile phone cameras and reminders of things that happened in the past.
It is also reasonably easy to work out why people are posting less and less of their own content and information to the site. Aside from concerns about privacy and security (an issue for many people, yes, but not for the majority of users, yet), there are a number of other reason why users may have changed their posting style. One is the increased use of mobile phones to access the site: in December 2015, of the 1.59 billion accesses to the site, 1.44 billion of these were from a mobile device (Facebook, 2016a). Mobile devices make it easy to share links and posts from other people, but typing an original post is fiddly and annoying. It is obvious to anyone who has accessed the Internet from a mobile device that although it is convenient, portable, and cheap, it changes the focus of the experience from interaction to consumption (with the occasional “like” or other one-click response).
Age is another factor, and the changing nature of friend groups on Facebook. Facebook is increasingly the mature person’s social network: in 2015 79% of online Americans between 30 and 49 were active users of Facebook, 64% of those 50 to 64 and 48% of those over 65 using the site. Compare Instagram, with only 11% of people between 50 and 64 using the site, and Twitter at 13 (Perrin, 2015). The South African Social Media Landscape 2016 report shows that 54% of Facebook users are over 30 (World Wide Worx, 2016). Reliable statistics for other countries are scarce, but sources from 2014 claim that globally 47% of the people on Facebook are over 35, with an additional 24% being 25 to 34 (Jetscram, 2014; Statista, 2015).
Older people tend to have a wider circle of friends and acquaintances on the Internet, to be more concerned about how they appear to those people (which may include colleagues, classmates and distant relatives), and to be more constrained by concerns for the privacy of others (as an example, I don’t post about my work on Facebook because most of my work involves information about students which I am not at liberty to share), and to be aware of the consequences of injudicious disclosure.
What is not clear is why Facebook cares how much personal content you post, as opposed to sharing of other content. In fact, the company seems somewhat confused on this issue, since it has been actively creating services and functions which make it easier to do so.
Facebook Pages were launched in 2007, a clear response to the ways in which the service was being used. Not all users are individual people, and companies and services were using the site to promote themselves. Rather than have an organisation complete a profile (complete with relationship status and details about where you went to school), the site allowed entities other than inviduals to create pages within the site. Pages have been somewhat controversial, with many users finding them frustrating, and increasingly linked to paid services and promotions, but they were the mechanism by which news organisations began to appear on the site as entities, rather than as a function of journalists’ personal profiles.
In 2008 Facebook launched Facebook Connect, which allowed users to share their profile information with other websites and which in turn led to the development of Facebook Share in 2009 (Ostrow, 2008; Parr, 2009). Both functions seemed to have been tailor-made for news organisations – Facebook Connect provide sites with the ability to track and identify users without them needing to register separately for each site, and was widely used for comment management by news sites, Facebook Share allowed sites to provide a button that automatically shared that page on Facebook, under the user’s profile. This had been possible previously, and many sites did offer this as a way to attract users to their site, but the official button allowed sites to track shares and comments that the article garnered on Facebook itself. This trackback allowed publishers to see Facebook usage as part of their own traffic, and to track the popularity of their stories across the social network (Parr, 2009).
Both of these services were created in response to other social networks, such as Twitter, which has always made it easy to share links and stories across their network. Twitter has been perceived as being more of interest to journalists and news organisations than Facebook was, primarily because of the public nature of profiles and feeds, and its early adoption by journalists worldwide (Knight, 2013, 2012, 2011; Manjoo, 2015), and it seems clear that Facebook was wanting to capitalise on the traffic generated by news on social media.
More recently, additional services have been added which clearly point towards the site being seen by its management as providing a news distribution and consumption service. Instant Articles, launched in May 2015, allows news organisations to publish directly to the site, and generate advertising, commentary and traffic not to their main page, but to their presence within Facebook. Response has been mixed, but support is still strong, and many major players, including The New York Times, Buzzfeed and Gawker, are continuing to use the service (Griffith, 2015a, 2015b; McAlone, 2015).
Coupled with Instant Articles was the launch of “Trending News” in mid-2015. This is a panel of links and articles to things that are trending on the site, sorted by category (news, politics, science and technology, entertainment and sports), and based on “a number of factors including engagement, timeliness, Pages you’ve liked and your location” (Facebook, 2016b). Comparisons to Twitter’s Trends feed are inevitable, and not unwarranted. The Follow option was added in 2013. Technically, this was not a new service, but a rebranding of the old “subscribe” option to more closely mimic the wording and behaviour from other sites. The function of the “Follow” button is similar to other social networks. Instead of requiring a reciprocal relationship and the explicit exchange of Friendship status on the site, a user with a public profile (Facebook themselves suggest that the service can be used to follow celebrities and journalists, specifically (Facebook, 2016c)) can allow people to Follow them, which will allow followers to see their updates and comments without needing to be their friend. The service is clearly intended to allow celebrities and public figures to maintain an asymmetrical relationship with strangers, using the site more as a publishing platform than as a social sharing and interaction system (Darwell, 2012).
This is being used to interesting effect by a number of people and small news organisations. Definitely, the ability to post lengthy posts, to have followers who see your content, and to manage your Facebook page/account as a sole proprietor has meant that many people use the site as a kind of personal blog or website. Certainly, there is an increasing amount of original content on the service, and only on the service (as opposed to being published elsewhere and linked or shared on Facebook), and the barriers to entry for this kind of publishing are infinitesimal. However, this is a limited and closed option for anyone producing content. You cannot generate revenue (as things currently stand) by posting on Facebook alone, since the advertising is not yours. In addition, it is not unheard of for Facebook to close accounts that it sees as violating its terms, which change frequently. For anyone posting content on Facebook, you are agreeing to their terms of service, which includes granting them a license to use your content as they see fit.
All of these services indicate that Facebook is clearly happy to have news organisations use the site to engage with their readers, to share and comment on stories, and to provide content that can be easily shared and read. And users agree. Increasingly, Facebook is being used as a source of information about the world. According to the Pew Research Centre, 63% of the service’s users see it as a source of news. Flipping the statistic, in 2015, 41% of US adults got some or all of their news and current affairs information through Facebook, and the number is increasing. The trend is moving away from Twitter as a news source, not because Twitter has less news, or is less used by its membership as a source of news, but because Twitter has fewer active users. (Barthel et al., 2015).
People have to get their news from somewhere, and if the public, and the news organisations are on Facebook (and they increasingly are), then getting news from Facebook makes sense. The issue is what kind of news is available on Facebook, and what users actually see.
Facebook was set up as the original social network and it was explicitly designed to only allow online connections to people with whom you have some connection in the real world. The reciprocal nature of connections on the site (in order to be connected to someone, both of you have to agree that you are “friends”) and habits around privacy and searching means that most Facebook connections remain within the original scope of the site: people you are friends with in the non-online world. This is in contrast with Twitter, where all users are public by default, and people tend to follow a wider range of other users.
For Facebook, this means that most people’s networks resemble their own social group in terms of class, race, language and culture. Given that Facebook’s “trending” list is not an absolute measure of popularity (unlike Twitter’s), but is customised based on your own likes and information, and that the material that appears in your news feed is only that which has been seen and reposted by your friends, that makes the site an echo chamber, in which you are unlikely see news and opinions you disagree with, or to be exposed to news from places and communities with which you have little connection. As Facebook’s news feed algorithm responds to what you comment on and share, this can easily become a spiral of repetition, so that if you never “like” something a friend posts, you will be unlikely to see anything else from them again. In the interests of keeping you on the site, or making it a comfortable place to hang out, Facebook doesn’t challenge you, it doesn’t make you think or make you uncomfortable, and it will deliberately shield you from things you disagree with. This is diametrically opposed to what is often considered to be the point of journalism – to tell you something you don’t already know, to make you think about things differently, and to illuminate things that are hidden.
A study conducted in 2014 by researchers based at Facebook and at the University of Michigan found that users were less exposed to content that conflicted with their stated political affiliation (political viewpoint is a field in the Facebook profile), and less likely to click on or share a link that they disagree with (Bakshy et al., 2015). As the algorithm learns from this behaviour, it will show less and less of that content, and it will be lower down the feed. An interesting demonstration of this is available on the Wall Street Journal’s site, with an interactive tool using the same data as Bakshy et al’s study. The difference in news content is startling. (Keegan, 2016) Although this article, and this demonstration, is based on US users and US-based content, the algorithm is universal, so users in any country and language will see the same pattern emerge.
Facebook’s algorithm is invisible. Although it is possible to turn off the automatic ranking of posts on your news feed, and see material in chronological order, it is not offered as a highly visible option (and is not available at all on the mobile application, which is how the majority of users use the service (Facebook, 2016a; World Wide Worx, 2016)) so most users have no idea that they are seeing a filtered selection of the posts available. The algorithm itself is secret, and based on constantly updated proprietary code. (Somaiya, 2014)
Facebook’s trending news service is not purely algorithmic, but is based on a curated list of content, that may or may not be subject to direct political interference, depending on which news source you believe. Gizmodo recently ran articles on how the curation service works, and included accusations from one former journalist that they had been instructed to ignore popular news from conservative news organisations when choosing stories for the trending list. The accusations have not been repeated elsewhere, but the fact remains that what is presented as a simple “what is popular now” service, is in fact a customised and selected list of what the company thinks the reader might be interested in. Selection is fundamental to traditional news organisations, but this is based on a complex set of ideas about what news is, what is important, and what is interesting to the readers. This is not to imply that the mix of news provided by traditional news outlets is perfectly balanced, but there is more thought and consideration put in to the mix. Facebook’s service seems to be based purely on popularity, and privileges particular kinds of content. Bakshy’s study shows that only 13% of news shared on the site is hard news (politics and current affairs), a far lower proportion than is typical of traditional news outlets. The fact that Buzzfeed and Gawker are now among Facebook’s key partners in the development of Facebook Live and Instant Articles indicates the appeal of the service to particular kinds of content and news.
The economy of the Internet privileges particular kinds of content, content that has a hook, or the ability to generate lots of comment and sharing. As Facebook now makes it possible for news organisations to track stories’ popularity across the site, and to gain instant feedback on what is popular, and as news organisations increasingly rely on online advertising for revenue, it is inevitable that organisations will look to create stories that will be popular on the site. Since popularity is not linked only to what people like, but to what they share and comment on, this means that extreme points of view are more likely to become popular (and there is an argument to be made that Donald Trump’s popularity is the result of this). This is not to say that Facebook is alone in this – all news organisations are increasingly focused on popularity and sharing, and the effect is readily visible on many news sites. However, the combination of this tendency, coupled with the echo chamber effect of the news feed, and the overwhelming popularity of the service (at the expense of other media consumption, inevitably) creates a vicious circle.
A plurality of information sources is widely considered to be important for the development of society and its citizens. Facebook tends to monopoly (as do many other things in free market capitalism), in an ever-decreasing circle of popularity and consumption. The use of an automated algorithm, and a singular incentive (to increase the number of clicks, views and page shares) will inevitable mean that the system narrows and narrows the kinds of content it shows us. It is possible that people will become bored and frustrated by this, and move away from the service, or that the service will recognise this happening and alter the algorithm to surprise and inform people, but waiting for that might be too risky in the long term. Who’s to say that the providers of serious, thoughtful and intelligent comment and information will still be there, if we ever emerge from our bubble of cat videos and extreme rants.
?
Anders, G., 2014. The Evolution of Facebook – In Photos: The Evolution Of Facebook [WWW Document]. Forbes. URL http://www.forbes.com/pictures/emii45hdlj/the-evolution-of-facebook/ (accessed 5.30.16).
Bakshy, E., Messing, S., Adamic, L.A., 2015. Exposure to ideologically diverse news and opinion on Facebook. Science 348, 1130–1132. doi:10.1126/science.aaa1160
Barthel, M., Shearer, E., Gottfried, J., Mitchell, A., 2015. The Evolving Role of News on Twitter and Facebook. Pew Res. Cent. Journal. Proj.
Darwell, B., 2012. Facebook to change “subscribe” to “follow” [WWW Document]. URL http://www.adweek.com/socialtimes/facebook-to-change-subscribe-to-follow/287453 (accessed 5.30.16).
Efrati, A., 2016. Facebook Struggles to Stop Decline in “Original” Sharing [WWW Document]. The Information. URL https://www.theinformation.com/facebook-struggles-to-stop-decline-in-original-sharing (accessed 5.22.16).
Facebook, 2016a. Facebook Reports Fourth Quarter and Full Year 2015 Results – Facebook [WWW Document]. Facebook. URL http://investor.fb.com/releasedetail.cfm?ReleaseID=952040 (accessed 5.30.16).
Facebook, 2016b. Help Centre [WWW Document]. Facebook. URL https://www.facebook.com/help/1536354516620261/ (accessed 5.30.16).
Facebook, 2016c. Follow [WWW Document]. Facebook. URL https://www.facebook.com/about/follow (accessed 5.30.16).
Frier, S., 2016. Facebook “context collapse”: Users sharing more news, less personal information — Society’s Child — Sott.net [WWW Document]. SOTT.net. URL https://www.sott.net/article/316056-Facebook-context-collapse-Users-sharing-more-news-less-personal-information (accessed 5.30.16).
Griffith, E., 2015a. Facebook signs nine publishers to Instant Article – Fortune [WWW Document]. Fortune Mag. URL http://fortune.com/2015/05/13/facebook-buzzfeed-new-york-times/ (accessed 5.30.16).
Griffith, E., 2015b. Facebook looking to host news content – Fortune [WWW Document]. Fortune Mag. URL http://fortune.com/2015/03/24/facebook-news/ (accessed 5.30.16).
Jetscram, 2014. Social Media User Statistics & Age Demographics [WWW Document]. Jetscram LLC. URL http://jetscram.com/blog/industry-news/social-media-user-statistics-and-age-demographics-2014/ (accessed 5.30.16).
Keegan, J., 2016. Blue Feed, Red Feed See Liberal Facebook and Conservative Facebook, Side by Side. Wall Str. J.
Knight, M., 2013. The revolution will be facebooked, broadcast and published. doi:10.13140/RG.2.1.4948.4567
Knight, M., 2012. Journalism as usual: The use of social media as a newsgathering tool in the coverage of the Iranian elections in 2009. J. Media Pract. 13, 61–74.
Knight, M., 2011. The Origin Of Stories: How Journalists Find And Create News In An Age Of Social Media, Competition And Churnalism. Presented at the Future of Journalism, Cardiff, United Kingdom.
Manjoo, F., 2015. For Twitter, Future Means Here and Now. N. Y. Times.
McAlone, N., 2015. Publishers reveal what it’s really like using Facebook’s Instant Articles so far [WWW Document]. URL http://uk.businessinsider.com/initial-reactions-to-facebook-instant-articles-2016-3 (accessed 5.30.16).
Ostrow, A., 2008. Facebook Connect Launches with 24 Partners Including Digg and Six Apart [WWW Document]. Mashable. URL http://mashable.com/2008/07/23/facebook-connect-launches/ (accessed 5.30.16).
Parr, B., 2009. Facebook Launches Share Buttons for Publishers [WWW Document]. Mashable. URL http://mashable.com/2009/10/26/facebook-share-buttons/ (accessed 5.30.16).
Perrin, A., 2015. Social Media Usage: 2005-2015. Pew Res. Cent. Internet Sci. Tech.
Prashanth, S., 2013. Evolution of Facebook. Spinfold.
Somaiya, R., 2014. How Facebook Is Changing the Way Its Users Consume Journalism. N. Y. Times.
Statista, 2015. Social media user age distribution 2014 | Statistic [WWW Document]. Statista. URL http://www.statista.com/statistics/274829/age-distribution-of-active-social-media-users-worldwide-by-platform/ (accessed 5.30.16).
Woolf, N., 2016. The miracle of live: man uses Facebook Live to stream his child’s birth [WWW Document]. the Guardian. URL http://www.theguardian.com/technology/2016/may/17/facebook-live-birth-fakamalo-kihe-eiki (accessed 5.30.16).
World Wide Worx, 2016. South African Social Media Landscape 2016.

Education data in the media

This is a paper I am presenting at The Politics of Reception – Media, Policy and Public Knowledge and Opinion at Lancaster University, April 20th and 21st 2016.

The slides go into possible responses in more depth. They are available here.

All the data that’s fit to print: an analysis of the coverage in national newspapers of the 2013 PISA Report.  

Megan Knight, Associate Dean, School of Creative Arts, University of Hertfordshire.

Data is increasingly part of the public discourse, and how public bodies present information to the news media (and through them, to the public). Drawing on previous work on the subject (Knight, 2015), this paper analyses the presentation of one set of this data in the media, and is working to develop possible responses on the part of the data’s authors.

A total of 34 articles were analysed, from ten news outlets, including websites. Coverage ran over over a week, with the first article running before the release of the report, on December 1st, and the last on the 6th. The full text of the articles was retrieved from Nexis, and letters to the editor and duplicates were removed. Articles came from both the print and online outlets of the various news organisations.

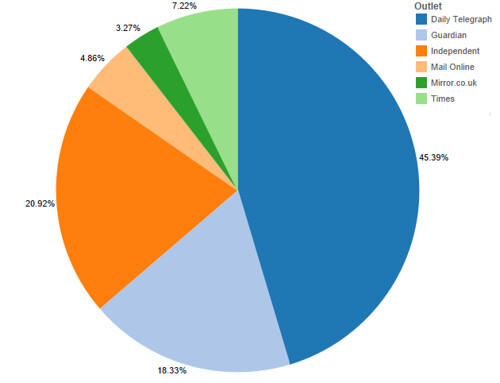
The Telegraph published the most articles, 16, including an online feature that contained within it nine short pieces, each highlighting an aspect of the results. The Guardian and the Independent had seven articles each, The Times three, and the Daily Mail and Mirror one each. By word count, the ratio is similar, although the Daily Mail article was twice the length of that of the Mirror, so it is a larger proportion of coverage.

figure one

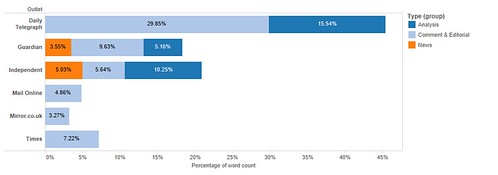
What is more interesting is the nature of the coverage. 53% was editorial or commentary, 19% analysis and only 28% was straight news reporting. Only two outlets, the Guardian and Independent, had a single report that simply announced the results, without comment or analysis. Only the Telegraph, Guardian and Independent reproduced any part of the data included in the report.

figure two

On analysing the overall coverage, an initial read-through of the Pisa Report was conducted (OECD, 2013), and the key concepts from the report were identified and tabulated. These might be expected to appear in the coverage of the report and are as follows: The range of subjects covered by the report, including Maths, Reading, Science, Problem Solving and Financial literary; Gender bias evidenced by the data; socio-economic factors that had an impact on performance; the relationship of the results to economic growth; the proportion of immigrant children in the classroom; the importance of motivation and culture to performance; expenditure on education; stratification of education (streaming) and teacher compensation.

figure three

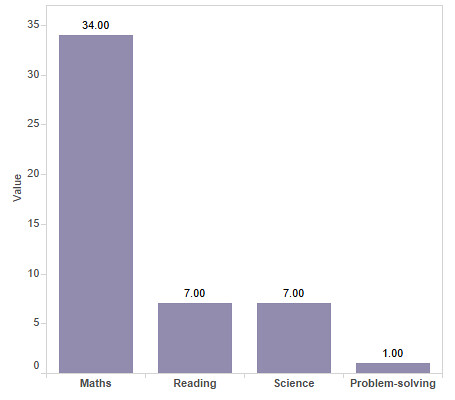
Of the four sections on the test, only one, Maths, was discussed in all the reports, Science and Reading were discussed in seven, Problem-Solving in one, and none of them mentioned Financial Literacy, a new area of study for the PISA report. 26 of the reports, 76% of the whole, only discussed the maths scores, and implied that the test was simply one of mathematical literacy. Of the eight that did discuss other aspects of the test, five did so in less than a sentence. The one report that did discuss problem-solving, an area of the test that the UK did well on, was an opinion piece by a Hong Kong schoolteacher, discussing concerns that future entrepreneurs in the city were being stifled by rote learning and test-taking in favour of softer skills.

figure four

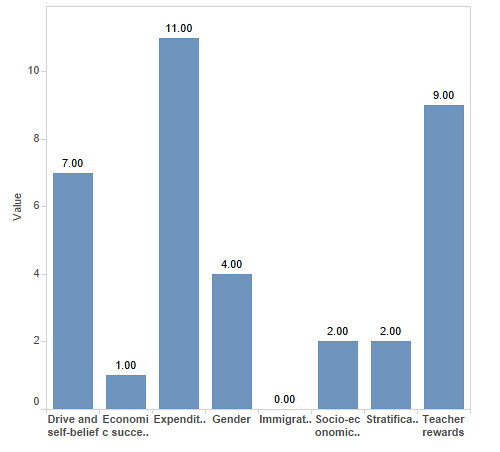
Coverage of the section of the report that discusses the relationship between the scores and other factors, including gender, socio-economic factors, economic growth, immigration, the culture of learning, expenditure on education, the stratification of the education system and teacher compensation was then analysed. Expenditure was discussed in eleven of the articles, in two, the implication was that the UK should spend more on education, in the others, the implication was strongly that the UK’s relatively low standing was despite its high spending. This is interesting, because although the UK spends a relatively large amount to educate each child (ninth in the rankings), the amounts are not adjusted for actual purchase value of currency, and the link was often presented in a negative light:“extra spending is no guarantee of higher performance, good news in an era of austerity” (Barber, 2013) Teacher rewards (financial and status) were mentioned in nine reports, but only one linked the UK’s performance with these issues in the UK.

The culture of education, including the drive and motivation of students was mentioned in seven reports, most often as a reason for the success of Asian countries. Gender was discussed or mentioned in four reports. Stratification and socio-economic factors were mentioned twice each, and immigration was never mentioned at all.

But, it is clear from the analysis that presenting the results of the Pisa report was not the main focus of the coverage. More than half of the coverage was in the form of editorial (written by the news organisation’s staff) or commentary (written by guest columnists). Ten of the articles explicitly politicised the issue, blaming the results on either the then-current government, or on the previous one. Fifteen of the articles presented the results in a negative light, using phrases such as “Britain is failing”, “fall down education league”, “stuck in the educational doldrums”, and “going backwards”. This despite the fact that the results are ambiguous, the UK’s ranking had increased slightly overall since 2009, and the country had done well on at least one measure of the test, problem-solving.

Eight of the articles presented the idea that Asia is “winning” the educational contest (as though education is a zero-sum game), in contrast to the UK’s “losing” of the same contest. Again, this is despite the fact that several non-Asian countries outperformed the UK as well.

Only three stories offered any critique of the study. Critiques were focused on the use of “plausible data” to fill in gaps and on the selection of Shanghai as a testing location. Minor critique was offered in two other articles, in the form of a caveat “academics question the validity of the test”, and four more criticised the ways in which various societies respond to the findings, accusing the test of effectively narrowing the range of debate on education policy and reinforcing a culture in which one’s maths scores are paramount. In only one of these articles did the journalist engage specifically with the data, and conduct their own analysis.

This politicisation of the issues is presented in line with the known political bias of the newspapers in question – the data was framed almost entirely in the context of the political landscape and the impact of the coalition government’s reforms of the education system in the UK.

None of this is surprising: education policy is highly political, and new information that reflects on that policy will inevitably be turned to political ends. The rhetoric of failure, of international standards as competition with winners and losers, and of the threat of economic (and possibly other) damage which may be wrought by China are established tropes in the UK news media, and the coverage here falls into a familiar pattern of blame and self-criticism.

So, what does this mean for academics and people working with this data, and wanting to ensure fair and useful coverage in the media? Much of the material below is based on well-accepted research into news values (Galtung and Ruge, 1965; Harcup and O’Neill, 2001), which discussed the ways in which news organisations make choices of stories and angles.

newspapers 1png

Journalists are superficial thinkers.

This is not an insult. Journalists tend to have a very wide range of knowledge and expertise, and to pick things up very quickly, but the converse of that is that they do not have the time (or often the inclination) to develop expertise and in-depth understanding of information. The report was released on December 3rd, and the first reports appeared the same day. Even allowing for early release to the media, it is likely that the journalists had only a day or two with the report, whose short form is 44 pages long and contains dozens of detailed and complicated tables, before needing to file their stories.

Every news organisation leapt on a single key point: the maths scores. This is in keeping with the main thrust of the report, and also with previous reporting on the issue. Since the report was expected, it is also likely that the news organisations prepared much of the material in advance, lining up experts and commentary before they knew what the results would be.

newspapers 2
Journalists (and readers) are uncomfortable with ambiguity.

Although the results are subtle, and the question of whether the UK has risen or fallen in the rankings is a complicated one, the final message was presented as a simple failure to improve. This is partially the result of the politicisation of the issue, partly the need for clear headlines.

Research is seldom simple, and the news media’s taste for unambiguous results and simple statements makes journalists and academics uncomfortable bedfellows. Academics are often frustrated with what they see as misrepresentation, and journalists with what they see as waffling or prevarication.

newspapers 3

Journalists are frightened of data.

The fact is, maths and data scare journalists, who tend to be drawn from the ranks of those who hated maths at school. The way in which data are presented in reports like the PISA report is particularly complicated, for academics, it can be hard to realise that any representation of data containing more than two value scales is baffling. [Insert figure 11.1.2 from p 14 of the report].

The stories were based almost entirely on the text contained in the press release and the narrative of the report, any information not conveyed in a simple skim of the report was not present in the coverage.

newspapers 4

Journalists rely on other people.

Journalists are trained not to voice their own opinions. The convention is still to use third parties, expert voices and commentary, to present arguments in a story. Obviously the journalist has control over who they interview, and can privilege one opinion over another in this process, but in practice, comment tends to come from the people the journalist knows and can trust to provide what is needed, in the right time frame. Researchers and academic staff are commonly used in interviews, and often actively court relationships with journalists.

In addition, some 40% of the articles presented were not written by journalists, but commissioned from experts and interested parties to present a range of perspectives and voices. This form of writing can be an excellent vehicle for academics and researchers to raise their profile and present their own research, again, provided they work within the known parameters of the news organisation.

Conclusions and issues.

  • Small increase in data journalism and data journalists
    • Costs and specialisations
  • Impact on policy
    • Cherrypicking and retrospective justification
  • Do journalists really matter?
    • Direct access to public opinion via social media


Works Cited

Galtung, J., Ruge, M.H., 1965. The Structure of Foreign News. J. Peace Res. 2, 64–91.

Harcup, T., O’Neill, D., 2001. What Is News? Galtung and Ruge revisited. Journal. Stud. 2, 261–280. doi:10.1080/14616700118449

Knight, M., 2015. Data journalism in the UK: a preliminary analysis of form and content. J. Media Pract. 16, 55–72. doi:10.1080/14682753.2015.1015801

OECD, 2013. PISA 2012 Results in Focus.


A Crisis in Numbers: data visualisations in the coverage of the 2015 European refugee crisis.

Notes for talk given for the Interactive Design Institute in London, October 2nd.

A few years ago I did a study on data journalism in UK newspapers. This grew out of work I had done in training students and journalists in data analysis and visualisation techniques. In that paper I discussed the varying approaches and techniques used in data journalism in print, and looked at developing a mechanism for measuring data journalism. (Knight, 2015)
I was asked to speak today based on this paper. I tend to get frustrated with work once it has been published, and get rather into the “never want to see or think about that again” mode, so I suggested a different title: A Crisis in Numbers: data visualisations in the coverage of the 2015 European refugee crisis. I suggested that because it was early August, and the news media had been full of the crisis, and there was a wide range of data analysis and visualisations evident in the media at that time.
I began collecting examples, but I confess it wasn’t intended as a definitive or comprehensive analysis, so I have not been as thorough as I was in the previous study. I also began to be more interested in the kinds of ideas or stories that were being represented in the visualisations, rather than the specifics and technicalities of the actual images and presentation. I ended up focusing only on a handful of publications – The Economist and New York Times were the richest sources, the Guardian and Telegraph offered some data, and I found very little else.
Based on a rough and instinctive analysis, I have extracted some themes that are evident in the examples I have. Again, this is rough, part of the process of developing ideas around analysing data journalism.
Origins:
Although the events of this summer are commonly referred to as the “Syrian refugee crisis”, it is clear that the refugees leaving the Mediterranean come from a wide range of countries, not only from Syria. A handful of visualisations looked at the origins of the refugees, but surprisingly, this was quite limited. One of them was based on year-old data, and somewhat misleading given the context of the story.

From: http://www.telegraph.co.uk/news/worldnews/europe/eu/11883027/What-is-the-difference-between-a-refugee-a-migrant-and-an-asylum-seeker.html

(Swidlicki, 2015)
The only other visualisation showing origin was part of a much larger piece, showing overall patterns in refugee migration globally. This was a more comprehensive image which showed origins and destinations of refugees globally. Although the image is striking, it’s not readily comprehensible.

From: http://www.nytimes.com/interactive/2015/06/21/world/map-flow-desperate-migration-refugee-crisis.html

(Peçanha and Wallace, 2015)
Routes:
The route refugees take from their country of origin to their final destination was a more widely reported aspect of the story – given that teh majority of refugees where coming through Eastern and Southern Europe, but aiming to get to Northern and Western Europe, this journey , and obstacles along it were a key aspect of the story.

From: http://www.economist.com/blogs/graphicdetail/2015/09/migration-europe-0

(“Time to go,” 2015)
The Economist’s map showing routes, entry points and way stations gives a good sense of the momentum of travel, and some of the border controls and areas that affected desired routes and destinations.

From: http://www.nytimes.com/interactive/2015/06/09/world/migrants-global-refugee-crisis-mediterranean-ukraine-syria-rohingya-malaysia-iraq.html

(Boehler and Peçanha, 2015)
The New York Times’ map shows one area in more detail, has more of a narrative feel to it. It’s telling the story with detail to flesh it out, rather than explaining the context and impact.
Incidents and Deaths: 

From: http://www.theguardian.com/world/ng-interactive/2015/sep/18/latest-developments-in-europes-refugee-crisis-a-visual-guide

(Jeffery et al., 2015)
The Guardians’ map of incidents along the route doesn’t show destinations, strictly speaking (it assumes one knows the context), but highlights specific events. Again, this is the use of a visualisation to identify and clarify a narrative, rather than illuminate or explain a phenomenon.

From: www.nytimes.com/interactive/2015/06/09/world/migrants-global-refugee-crisis-mediterranean-ukraine-syria-rohingya-malaysia-iraq.html

(Boehler and Peçanha, 2015)

The New York Times map of the Mediterranean, showing sinkings and deaths is a much starker indication of one aspect of the crisis, although it lacks the context of time.

From: http://www.economist.com/blogs/graphicdetail/2015/09/migration-europe-0

(“Death at sea,” n.d.)
The Economist’s approach to similar (if not identical) data is a much more straightforward line graph which gives a far better sense of the scale of the crisis.
Destinations:
By far the largest proportion of the material shown focused on destinations of migrants, especially within Europe. Both the Economist and New York Times produced maps showing the impact of Syrian refugees on neighbouring countries. The Economist is not clear, but these two maps seem to based on the same data on the base map. The Economist has complicated and confused the map somewhat with more dimensions and a graded colour key.

From: http://www.economist.com/blogs/graphicdetail/2015/09/migration-europe-0

(“Time to go,” 2015)

From: www.nytimes.com/interactive/2015/06/09/world/migrants-global-refugee-crisis-mediterranean-ukraine-syria-rohingya-malaysia-iraq.html

(Boehler and Peçanha, 2015)

The Economist also produced a complex (but more readable) visualisation showing the destinations of Syrian refugees and the proportion of the receiving countries’ population they represent.
Both this visualisation and the two previous ones clearly show that Syria itself, and neighbouring countries are bearing far more of the burden of the problem than even highly-affected European countries like Austria and Italy.

From: http://www.economist.com/blogs/graphicdetail/2015/09/daily-chart-crisis-context

The New York Times visualisation of the overall destinations of refugees, although it shows the local effect, tends to emphasise the impact on North America and Northern and Western Europe simply by the way the eye is drawn to the longer lines and dramatic sweeps.

From: http://www.nytimes.com/interactive/2015/06/21/world/map-flow-desperate-migration-refugee-crisis.html

(Boehler and Peçanha, 2015)

The Guardian opted for a much simpler visualisation which initially seems based on a treemap, but has some variation. What it does show well is the relative size of the refugee populations, and the impact of that within each country.

From: http://www.theguardian.com/world/ng-interactive/2015/sep/18/latest-developments-in-europes-refugee-crisis-a-visual-guide

(Jeffery et al., 2015)
The Telegraph focused on a handful of countries, showing relative numbers of asylum applications.

From: http://www.telegraph.co.uk/news/worldnews/europe/11884051/Foreign-Secretary-refugee-crisis-is-good-for-UK-renegotiation.html

(Holehouse, 2015a)
Fairness and quotas:

The issue of fairness, of whether the world was dividing up the burden equally became a dominant narrative of the discussion towards the end of August. A number of visualisations were developed that looked at this issue.
The Telegraph had a simple graph showing the size of the quota for each country:

From: http://www.telegraph.co.uk/news/worldnews/europe/11884051/Foreign-Secretary-refugee-crisis-is-good-for-UK-renegotiation.html
From: http://www.telegraph.co.uk/news/worldnews/europe/eu/11882355/Refugee-crisis-EU-migrant-refugee-quota-UN-ministers-meet.html

(Holehouse, 2015b)
They also showed bubbles showing the relative size, with details of where the refugees were currently residing.

From: http://www.telegraph.co.uk/news/worldnews/europe/eu/11882355/Refugee-crisis-EU-migrant-refugee-quota-UN-ministers-meet.html

(Holehouse, 2015b)

The Guardian showed both numbers and proportion of population.

From: http://www.theguardian.com/world/ng-interactive/2015/sep/18/latest-developments-in-europes-refugee-crisis-a-visual-guide

(Jeffery et al., 2015)
The issue of whether countries would take more or fewer if the quotas went ahead was also presented. The NYT’s map highlights some of the differences in Europe.

From: http://www.nytimes.com/interactive/2015/09/04/world/europe/europe-refugee-distribution.html

(Boehler and Peçanha, 2015)
The same data was used to show the specifics of how much under and over quota countries were:

From: http://www.nytimes.com/interactive/2015/09/04/world/europe/europe-refugee-distribution.html

(Boehler and Peçanha, 2015)
The New York Times also chose to look at GDP as well as size and number of refugees, and produced this:

From: http://www.nytimes.com/interactive/2015/09/04/world/europe/europe-refugee-distribution.html

(Boehler and Peçanha, 2015)
Final comments:
There were some issues that were clear on observation. The timeframe of data was never clear, and given that this is not a single event, but a surge in an ongoing movement, this is really problematic.
None of the visualisations clarified what was meant by refugees or migrants, and several were unclear on the data’s origins, making it hard to verify.
Overall, the Guardian was a disappointment (what happened to the Guardian’s data team and blog?), the Telegraph was limited and simplistic, the Economist complicated and in-depth and the New York Times both nuanced and visually powerful (although the spot colour orange and purple was a bit much after a while).

References:
Boehler, P., Peçanha, S., 2015. The Global Refugee Crisis, Region by Region. N. Y. Times.
Death at sea, n.d. . The Economist.
Holehouse, M., 2015a. Britain faces £150m cost for EU migrant crisis.
Holehouse, M., 2015b. EU quota plan forced through against eastern European states’ wishes.
Jeffery, S., Scruton, P., Fenn, C., Torpey, P., Levett, C., Gutiérrez, P., Jeffery, S., Scruton, P., Fenn, C., Torpey, P., Levett, C., Gutiérrez, P., 2015. Europe’s refugee crisis – a visual guide. The Guardian.
Knight, M., 2015. Data journalism in the UK: a preliminary analysis of form and content. J. Media Pract. 16, 55–72. doi:10.1080/14682753.2015.1015801
Peçanha, S., Wallace, T., 2015. The Flight of Refugees Around the Globe. N. Y. Times.
Swidlicki, P., 2015. This East-West split over EU refugee quotas will have long-lasting consequences.
Time to go, 2015. . The Economist.